
Key Takeaways:
Massachusetts, Colorado, and Washington are America's hardest-working states.
Seattle, San Francisco, and Chicago top the list of America's hardest-working cities.
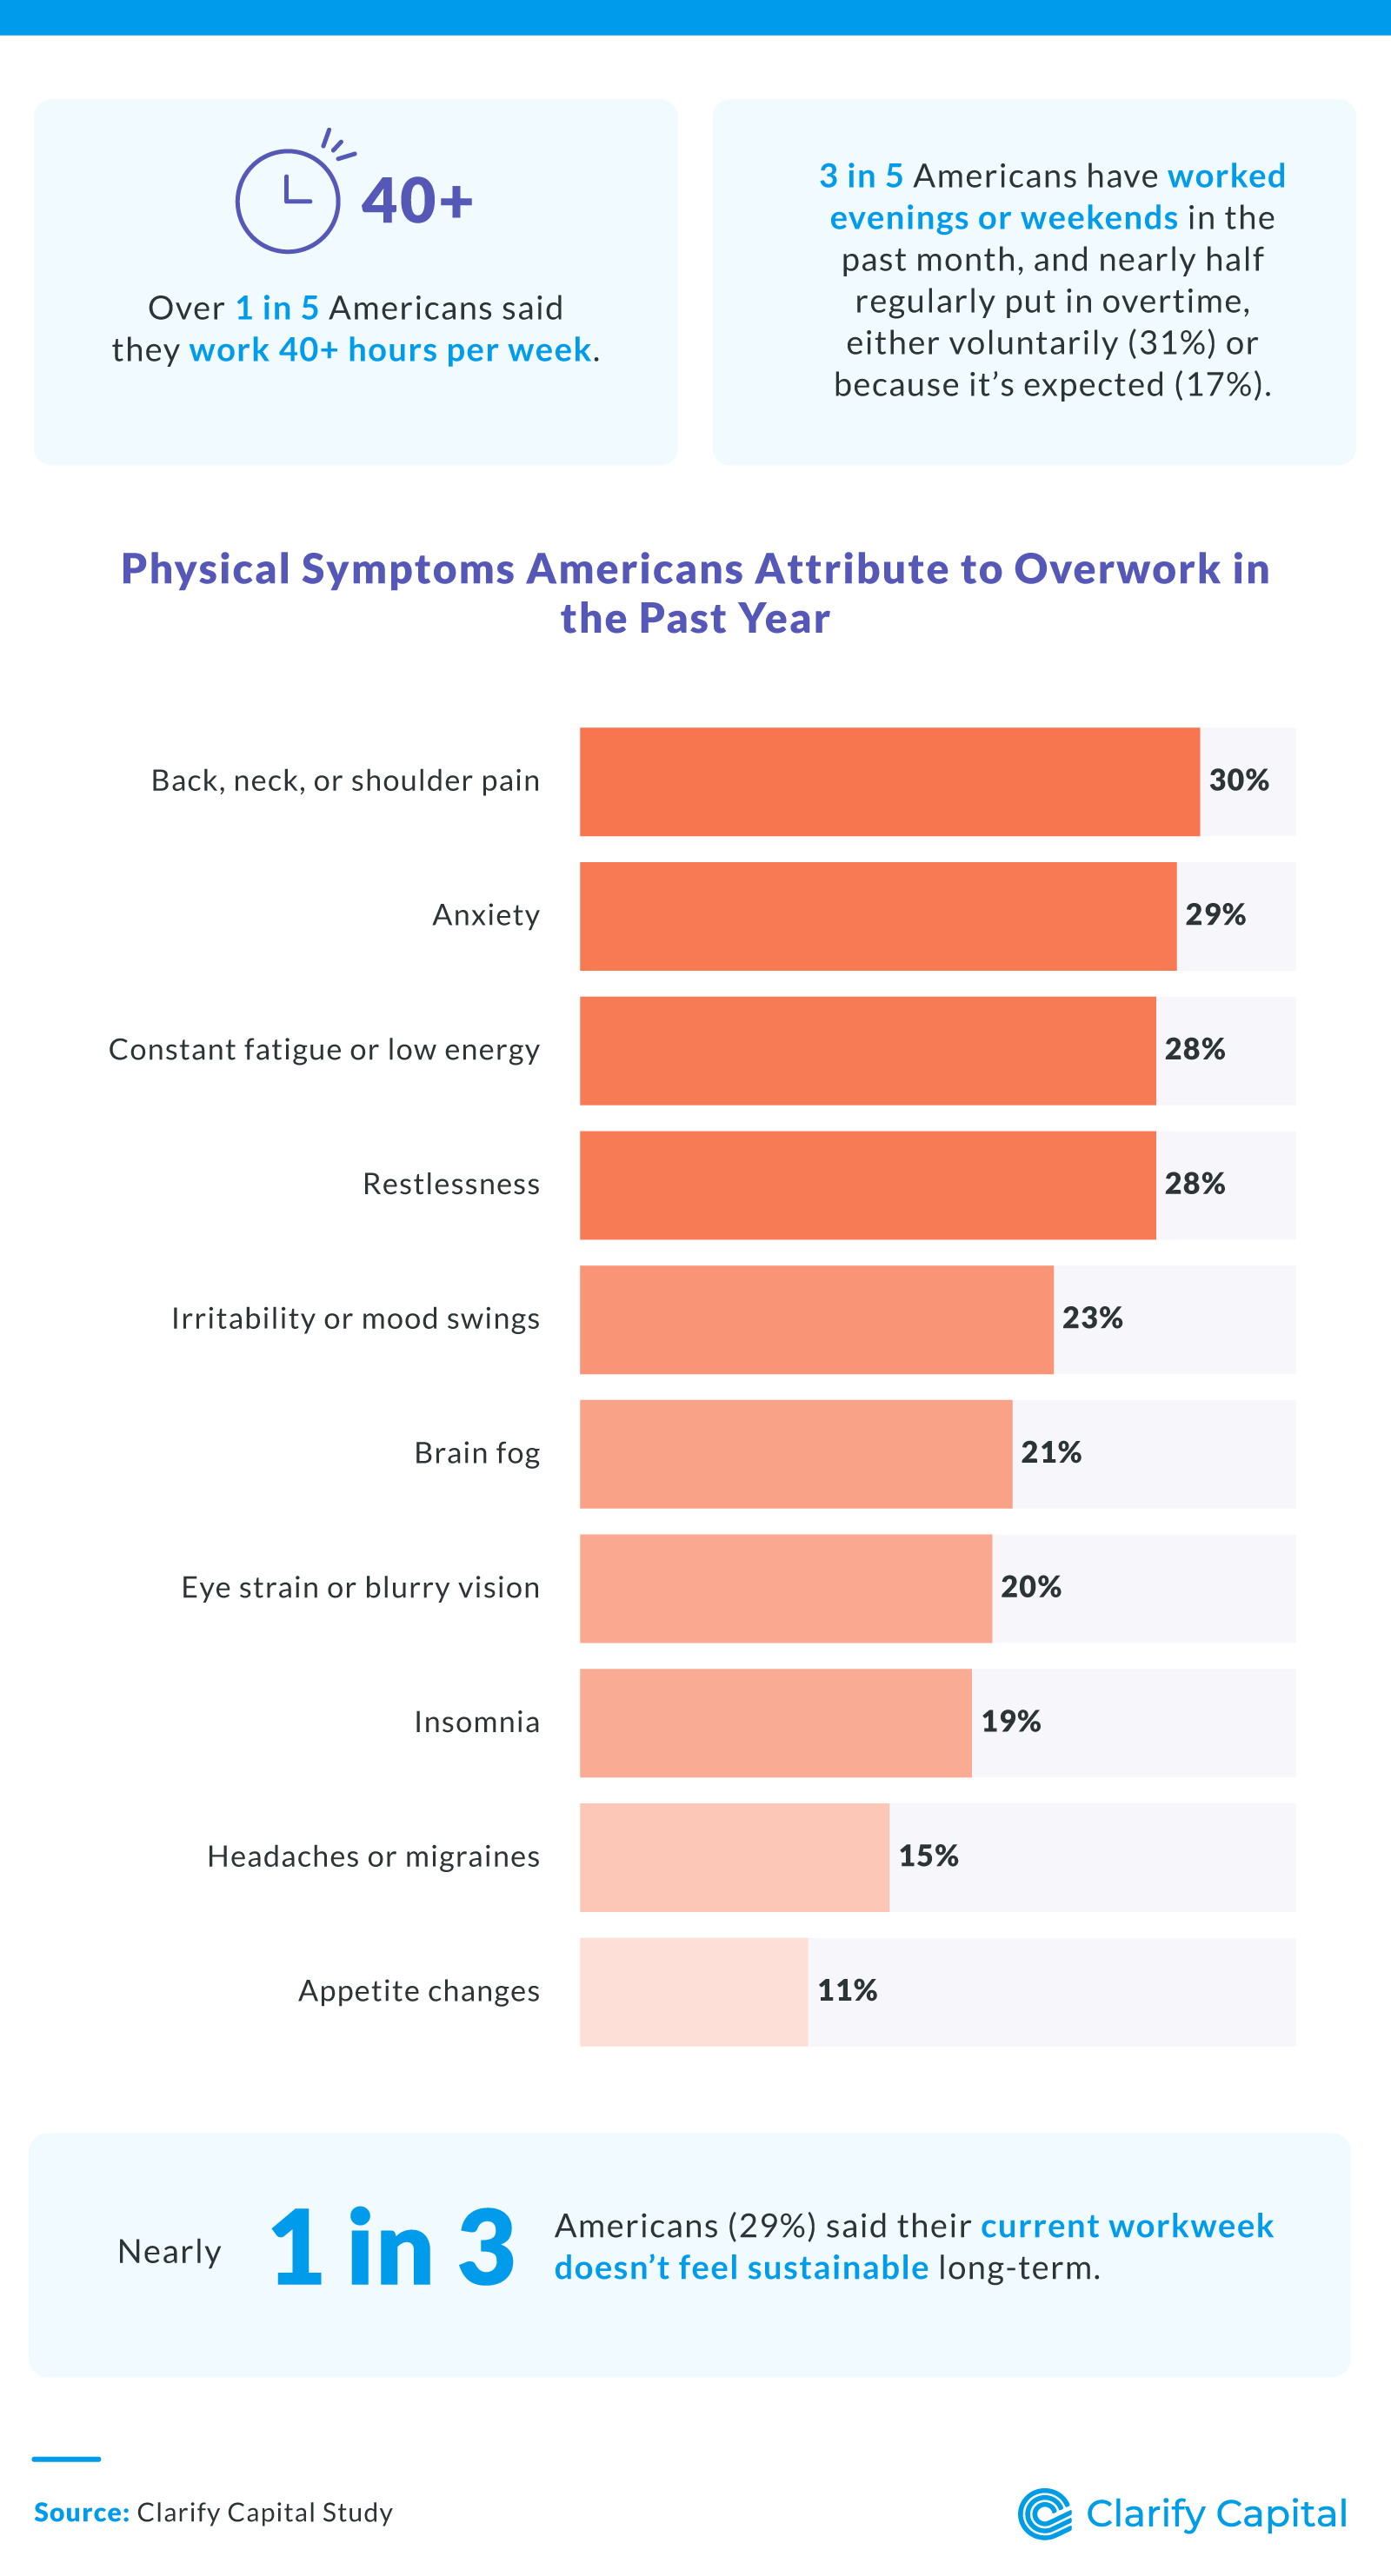
Over 1 in 5 Americans said they work 40+ hours per week.
3 in 5 Americans have worked evenings or weekends in the past month, and nearly half regularly work overtime, either voluntarily (31%) or because it's expected (17%).
2 in 5 Americans (41%) associate working long hours with ambition or success.
The Hardest-Working Places in America
Where Americans live can shape how much and how hard they work. Explore the data in the interactive chart below to see which states top the list.
At the state level, Massachusetts, Colorado, and Washington ranked as the hardest-working, based on average weekly hours, multiple job holdings, commute times, earnings, and employment rates. Each of these states had a strong job market with high workforce participation and long hours, a sign of economic strength but also a potential recipe for overworking.
Among the 25 most populous American cities, residents in Seattle, San Francisco, and Chicago had the longest workweeks. The top 10 hardest-working cities in the U.S. are:
Seattle, WA
San Francisco, CA
Chicago, IL
Fort Worth, TX
New York, NY
Houston, TX
Los Angeles, CA
Dallas, TX
Austin, TX
Philadelphia, PA
Seattle landed in the top spot, likely driven by its booming tech sector and a culture that values productivity. San Francisco, another tech hub, came in second. And part of the Midwest's strong work ethic and diverse economy, Chicago rounded out the top three.
Why Work-Life Balance Still Feels Out of Reach
Even with flexible work options, burnout is still common. Here's a look at how many Americans are overworking and what it's costing them.
Remote and hybrid work may offer more flexibility, but long hours are still the norm. More than 1 in 5 Americans reported working over 40 hours a week, and 21% said workplace flexibility actually led them to work more each week. When working remotely, 41% said they felt pressure to always be available. Another 18% felt that pressure during busy seasons or leadership transitions.
Certain industries are hit harder than others. The top five with the highest rates of 40+ hour workweeks are:
Real estate
Marketing
Consulting
Entertainment
Construction/Trades
More than half of Americans (51%) said they regularly check emails or work messages on weekends. Women (53%) were slightly more likely to do so than men (50%). And for many, work habits tie directly to identity. Forty-one percent of respondents associated long hours with ambition or success, with men (43%) slightly more likely to feel that way than women (40%).
Nearly 1 in 3 workers said their current workweek doesn't feel sustainable. Common symptoms tied to overwork include back, neck, or shoulder pain (30%), anxiety (29%), fatigue (28%), and restlessness (28%). Others reported mood swings, brain fog, and insomnia.
While 41% of Americans said they feel motivated when it comes to working, 37% felt burned out, 35% felt overwhelmed, 33% were frustrated, and 31% were bored. These numbers reflect a workforce walking a fine line between ambition and exhaustion.
Generational Views on Overworking
Work habits also vary by generation, and so does the pressure to push past boundaries. In the past month, 3 in 5 Americans worked evenings or weekends. Nearly half put in overtime, either by choice (31%) or because it was expected (17%). Gen X was the most likely to regularly work overtime due to expectations (20%), followed by millennials (16%) and Gen Z (15%). Only 3% of baby boomers said the same.
Adding to the pressure, 21% of Americans said they feel guilty logging off at a normal time, like 5 or 6 p.m. Baby boomers were the most likely to feel this way (24%), followed by millennials (22%), Gen Z (21%), and Gen X (19%). Baby boomers were also the most likely to tie ambition or success to long hours (52%), ahead of Gen X (43%), Gen Z (42%), and millennials (40%).
Baby boomers were the most likely to say their generation overworks more than others, at 45%. Gen X followed closely at 44%, with millennials at 39% and Gen Z at 30%. But in reality, Gen X was the most likely to regularly exceed 40 hours a week, with 33% working longer hours compared to 26% of millennials, 24% of boomers, and just 21% of Gen Z.
Interestingly, despite overworking the least, Gen Z was the most likely to say their current workweek feels unsustainable (34%), followed by millennials (30%), Gen X (25%), and boomers (24%).
Conclusion: Creating Balance in a Work-Obsessed Culture
America's hardest-working cities and states remind us that hustle culture is still alive and well. From coast to coast, professionals are pushing long hours due to industry demands, cultural expectations, and the blurred lines of remote work. For entrepreneurs and small business leaders, these trends underscore the need to create healthy work environments and sustainable routines that support long-term success.
Methodology
To identify the states with the most intense workweeks, we created a meta-ranking using six metrics that reflect not only how long people work, but also how hard they work to stay employed, commute, and maintain multiple responsibilities. Each state received a scaled score based on a weighted average of the following indicators:
Average weekly hours (30%): Sourced from the U.S. Bureau of Labor Statistics (BLS), this metric captures the average number of hours worked weekly by private-sector employees.
Percent working 35+ hours, 50+ weeks (20%): From the U.S. Census Bureau's American Community Survey, this reflects the proportion of workers consistently employed full-time year-round.
Percent with multiple jobs (15%): Pulled from the Census Bureau's 2024 report on jobholding, this shows the share of workers juggling more than one job.
Mean commute time (15%): Also from the Census, this represents the average time (in minutes) spent commuting to work, a key contributor to daily work intensity.
Average weekly earnings (10%): Taken from BLS data, this adds financial context to the workweek.
Unemployment rate (10%): Also from the BLS, we inverted this score to reward states with lower unemployment, signaling stronger and more consistent employment conditions.
All metrics were normalized using min-max scaling, then combined using the weights above to produce a composite "Scaled Score." This score was used to assign each state's Final Rank.
We also surveyed 1,000 Americans to uncover which professionals are voluntarily working extended hours. Of the respondents, 60% identified as millennials, 24% identified as Gen X, 12% identified as Gen Z, and 3% identified as baby boomers.
About Clarify Capital
Clarify Capital helps small business owners secure funding fast with simple, transparent financing options. From no-doc business loans to fast business loans, Clarify makes it easier to grow your business without getting buried in paperwork. As this report shows, Clarify understands the realities of hard work and is committed to supporting entrepreneurs every step of the way.
Fair Use Statement
If you'd like to share this study, you're welcome to do so for noncommercial purposes. Please include a link back to Clarify Capital to provide proper credit.

Bryan Gerson
Co-founder, Clarify
Bryan has personally arranged over $900 million in funding for businesses across trucking, restaurants, retail, construction, and healthcare. Since graduating from the University of Arizona in 2011, Bryan has spent his entire career in alternative finance, helping business owners secure capital when traditional banks turn them away. He specializes in bad credit funding, no doc lending, invoice factoring, and working capital solutions. More about the Clarify team →
Related Posts