
 Reviewed by
Key Takeaways:
More than half of the women business owners who started a financing application (56%) talked themselves out of completing it, compared to 43% of men.
Men were 24% more likely to be confident than women going into or during the financing process (54% vs 44%).
More than 2 in 5 women who have ever applied for business financing (44%) downsized their ask out of fear of rejection, compared to 1 in 3 men (33%).
Nearly 1 in 4 female founders (23%) delayed a hire, and nearly 1 in 3 (31%) cut inventory as a direct result of receiving less financing than they needed.
Differences in Confidence and Capital
For many women founders, the hardest part of getting financing isn't the application itself. It's getting to the point of submitting one.
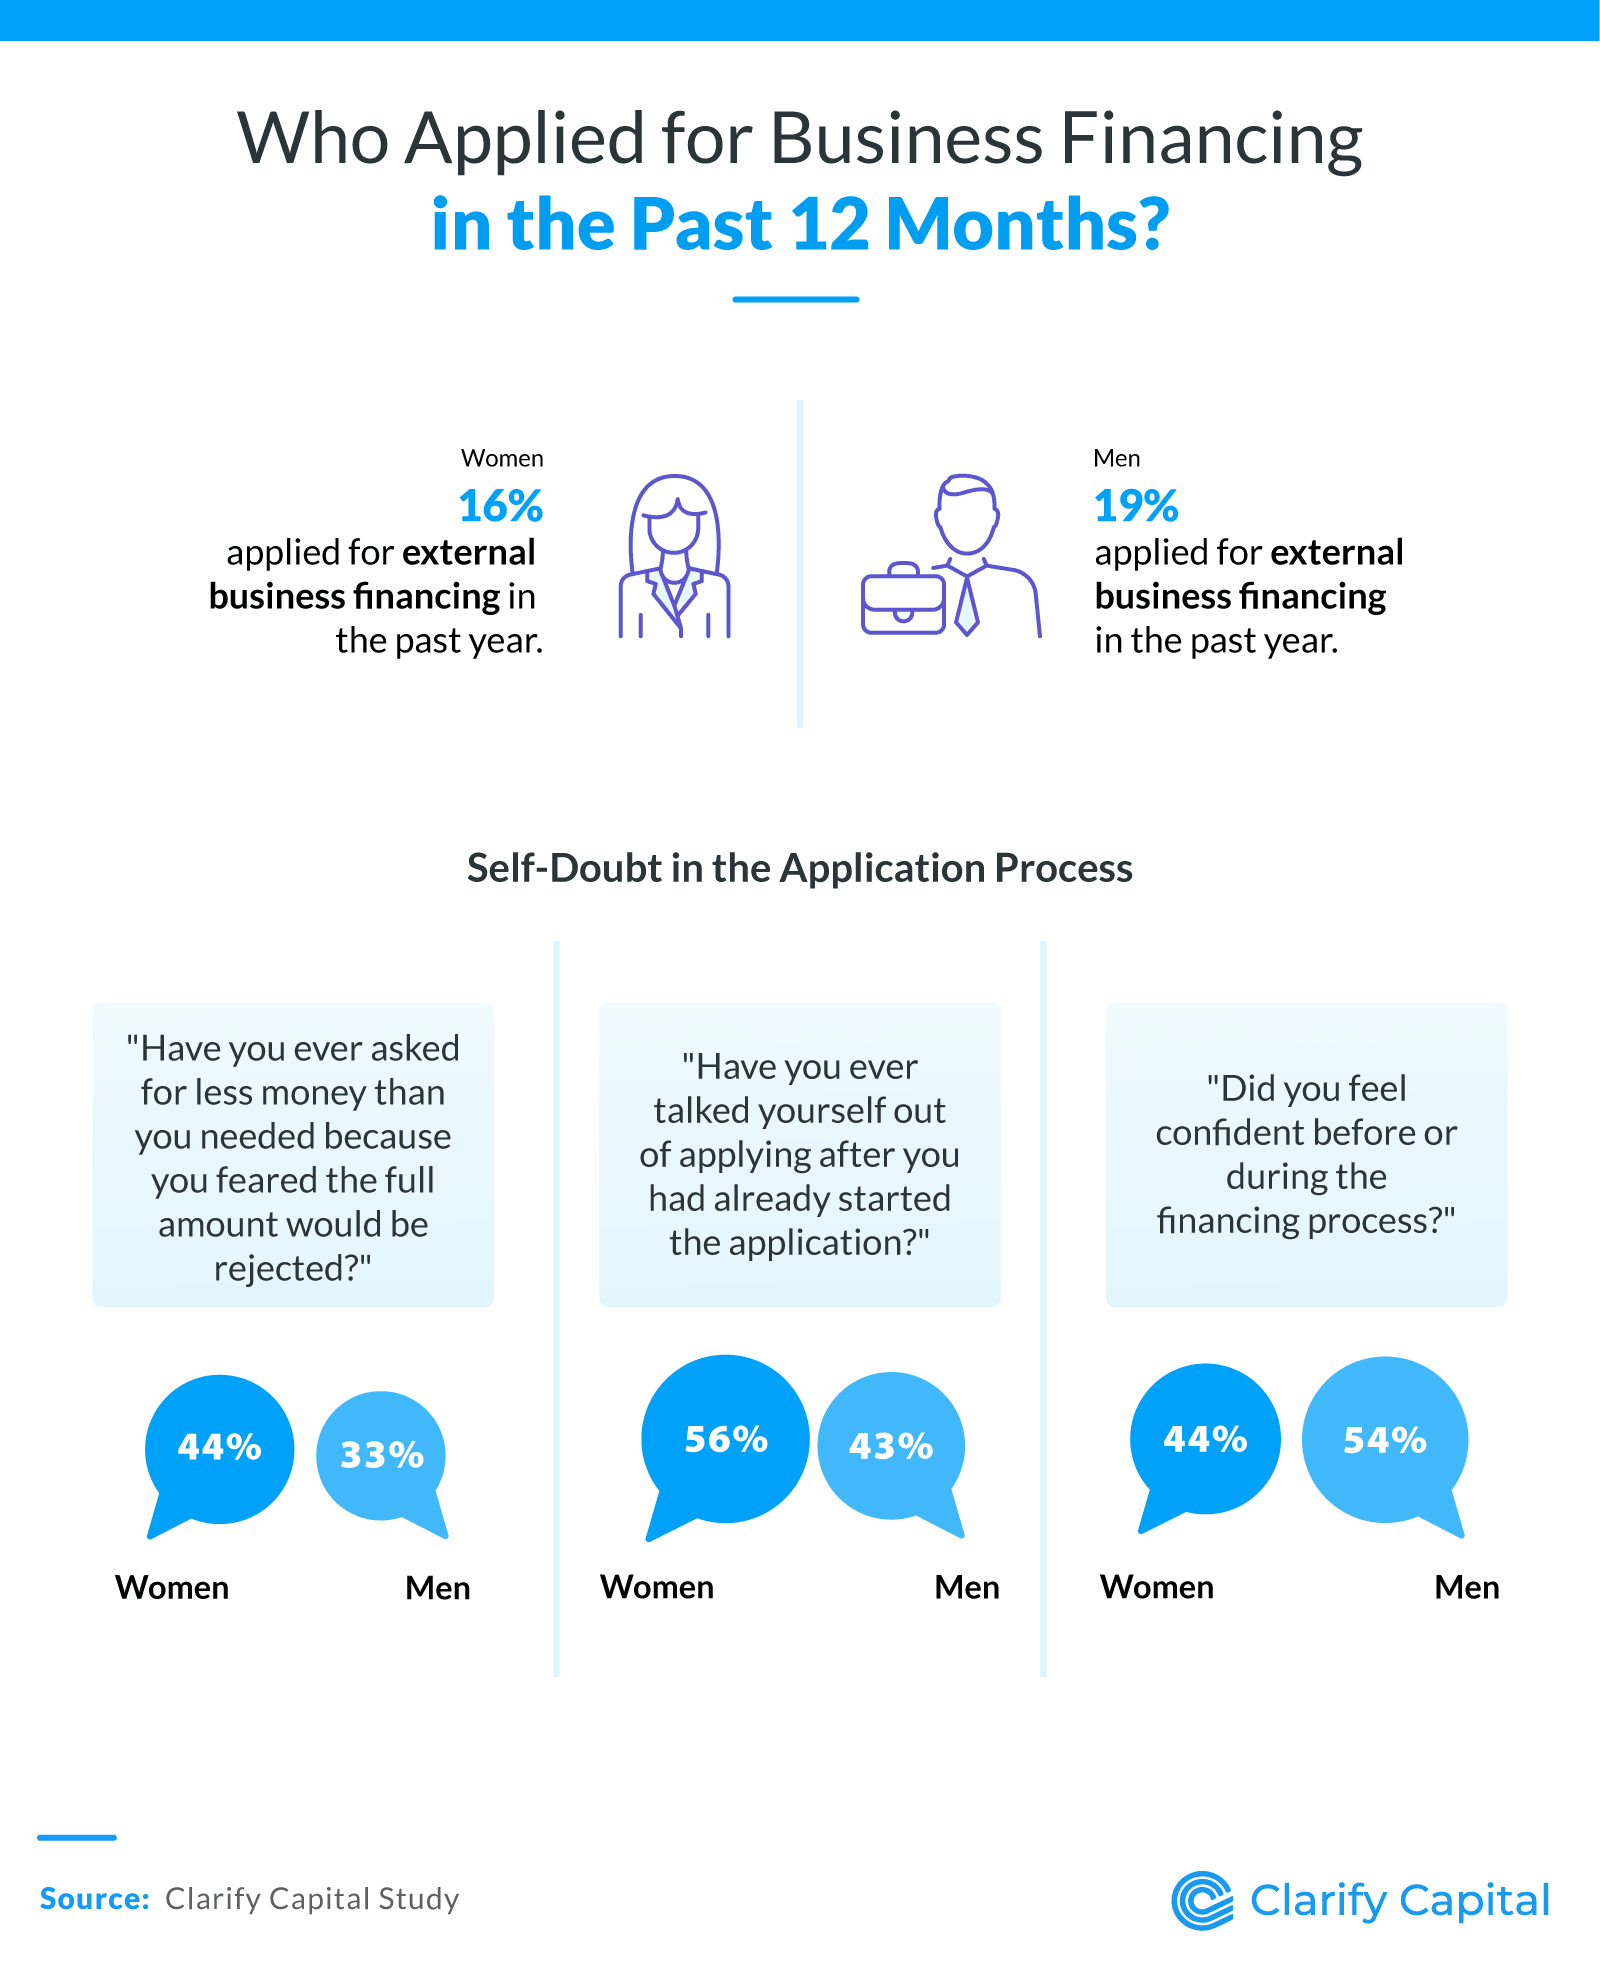
Women applied for external business financing at a lower rate than men in the past 12 months, with 16% of women applying compared to 19% of men. While the gap in application rates may seem small, the data suggests the reasons behind it run deeper than simple preference or need.
Confidence plays a significant role in who applies and how. Men were 24% more likely to describe themselves as confident going into or during the financing process, with 54% saying so compared to 44% of women. That difference in self-assurance shows up in how founders engage with financing applications.
Among business owners who have ever applied, 44% of women lowered their financing request out of fear that the full amount would be rejected, compared to 33% of men. Women aren't just asking for less, they're also talking themselves out of asking at all. More than half of women who started a financing application (56%) walked away before completing it, compared to 43% of men.
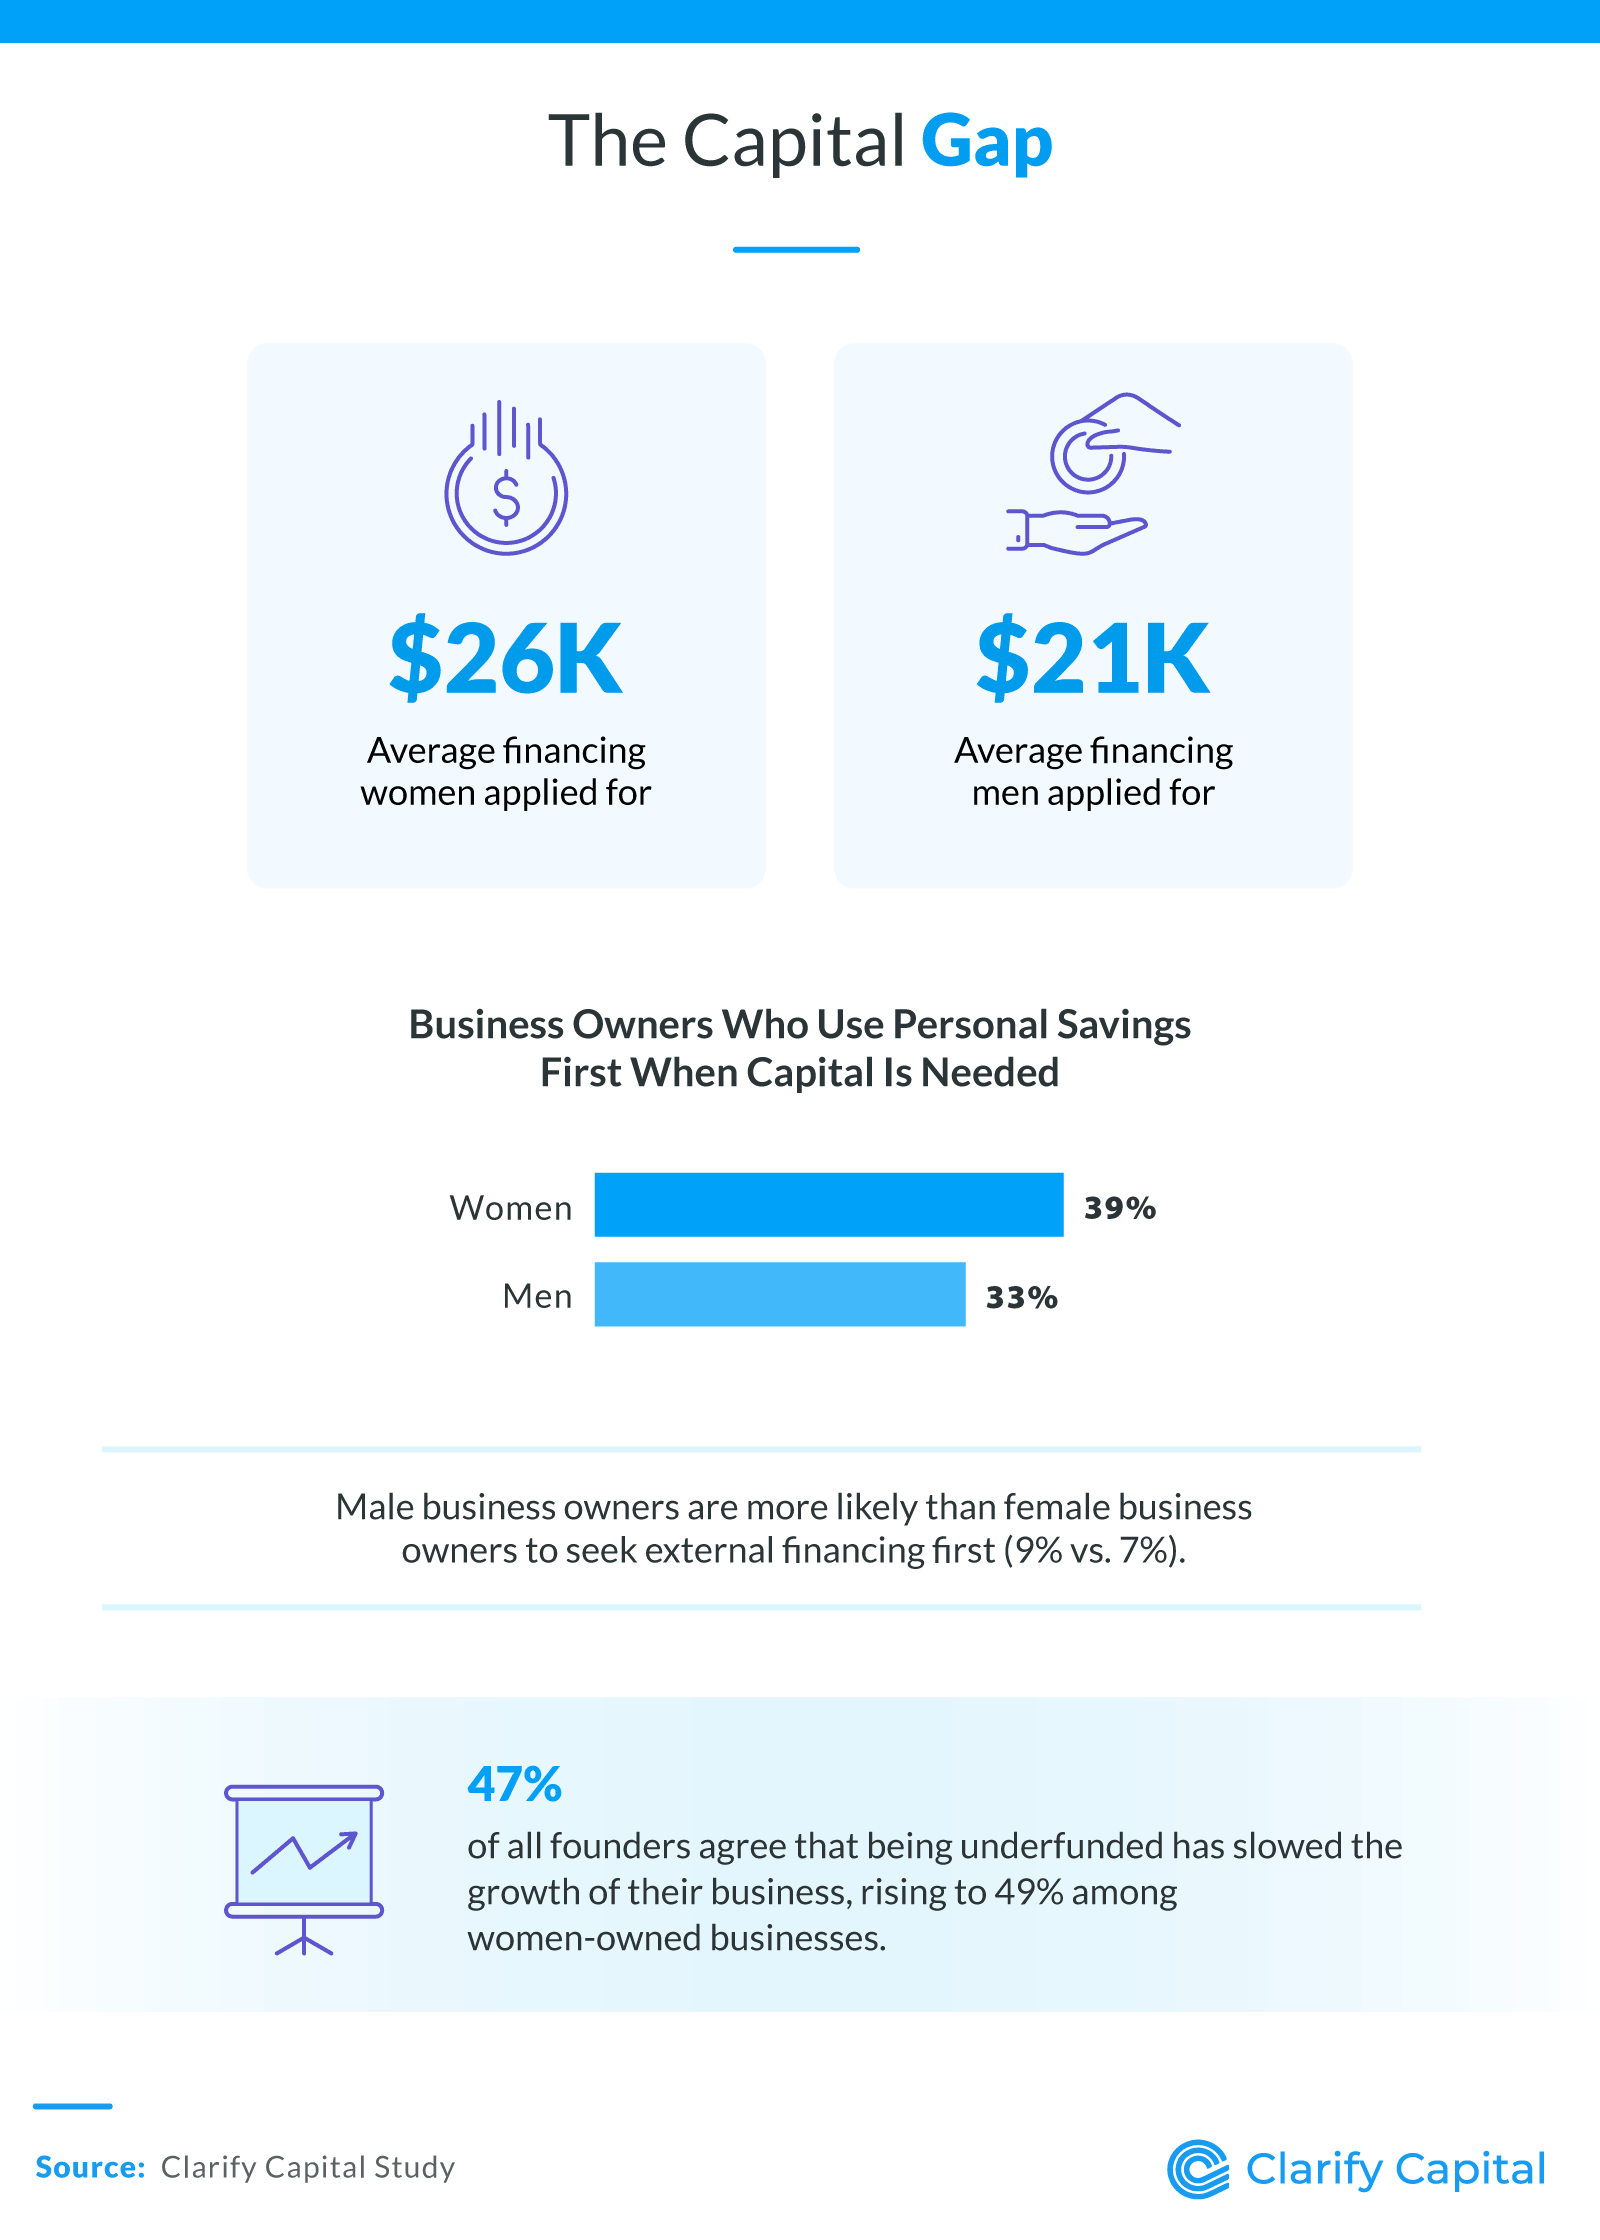
When their businesses need capital, women are more likely to turn inward before turning to a lender. Nearly 2 in 5 women (39%) reached for personal savings first when their business needed capital, compared to 33% of men. Men were more likely to seek external financing as their first move.
Among those who applied for financing, women requested an average of $26K compared to $21K for men, meaning women asked for more, yet still faced greater uncertainty about whether they would receive it. The financial impact of being underfunded is felt broadly, but more acutely among women. Nearly 1 in 2 women founders (49%) said being underfunded has slowed the growth of their business, compared to 45% of men.
The Ask vs. the Outcome
When women apply, the gap follows them in.
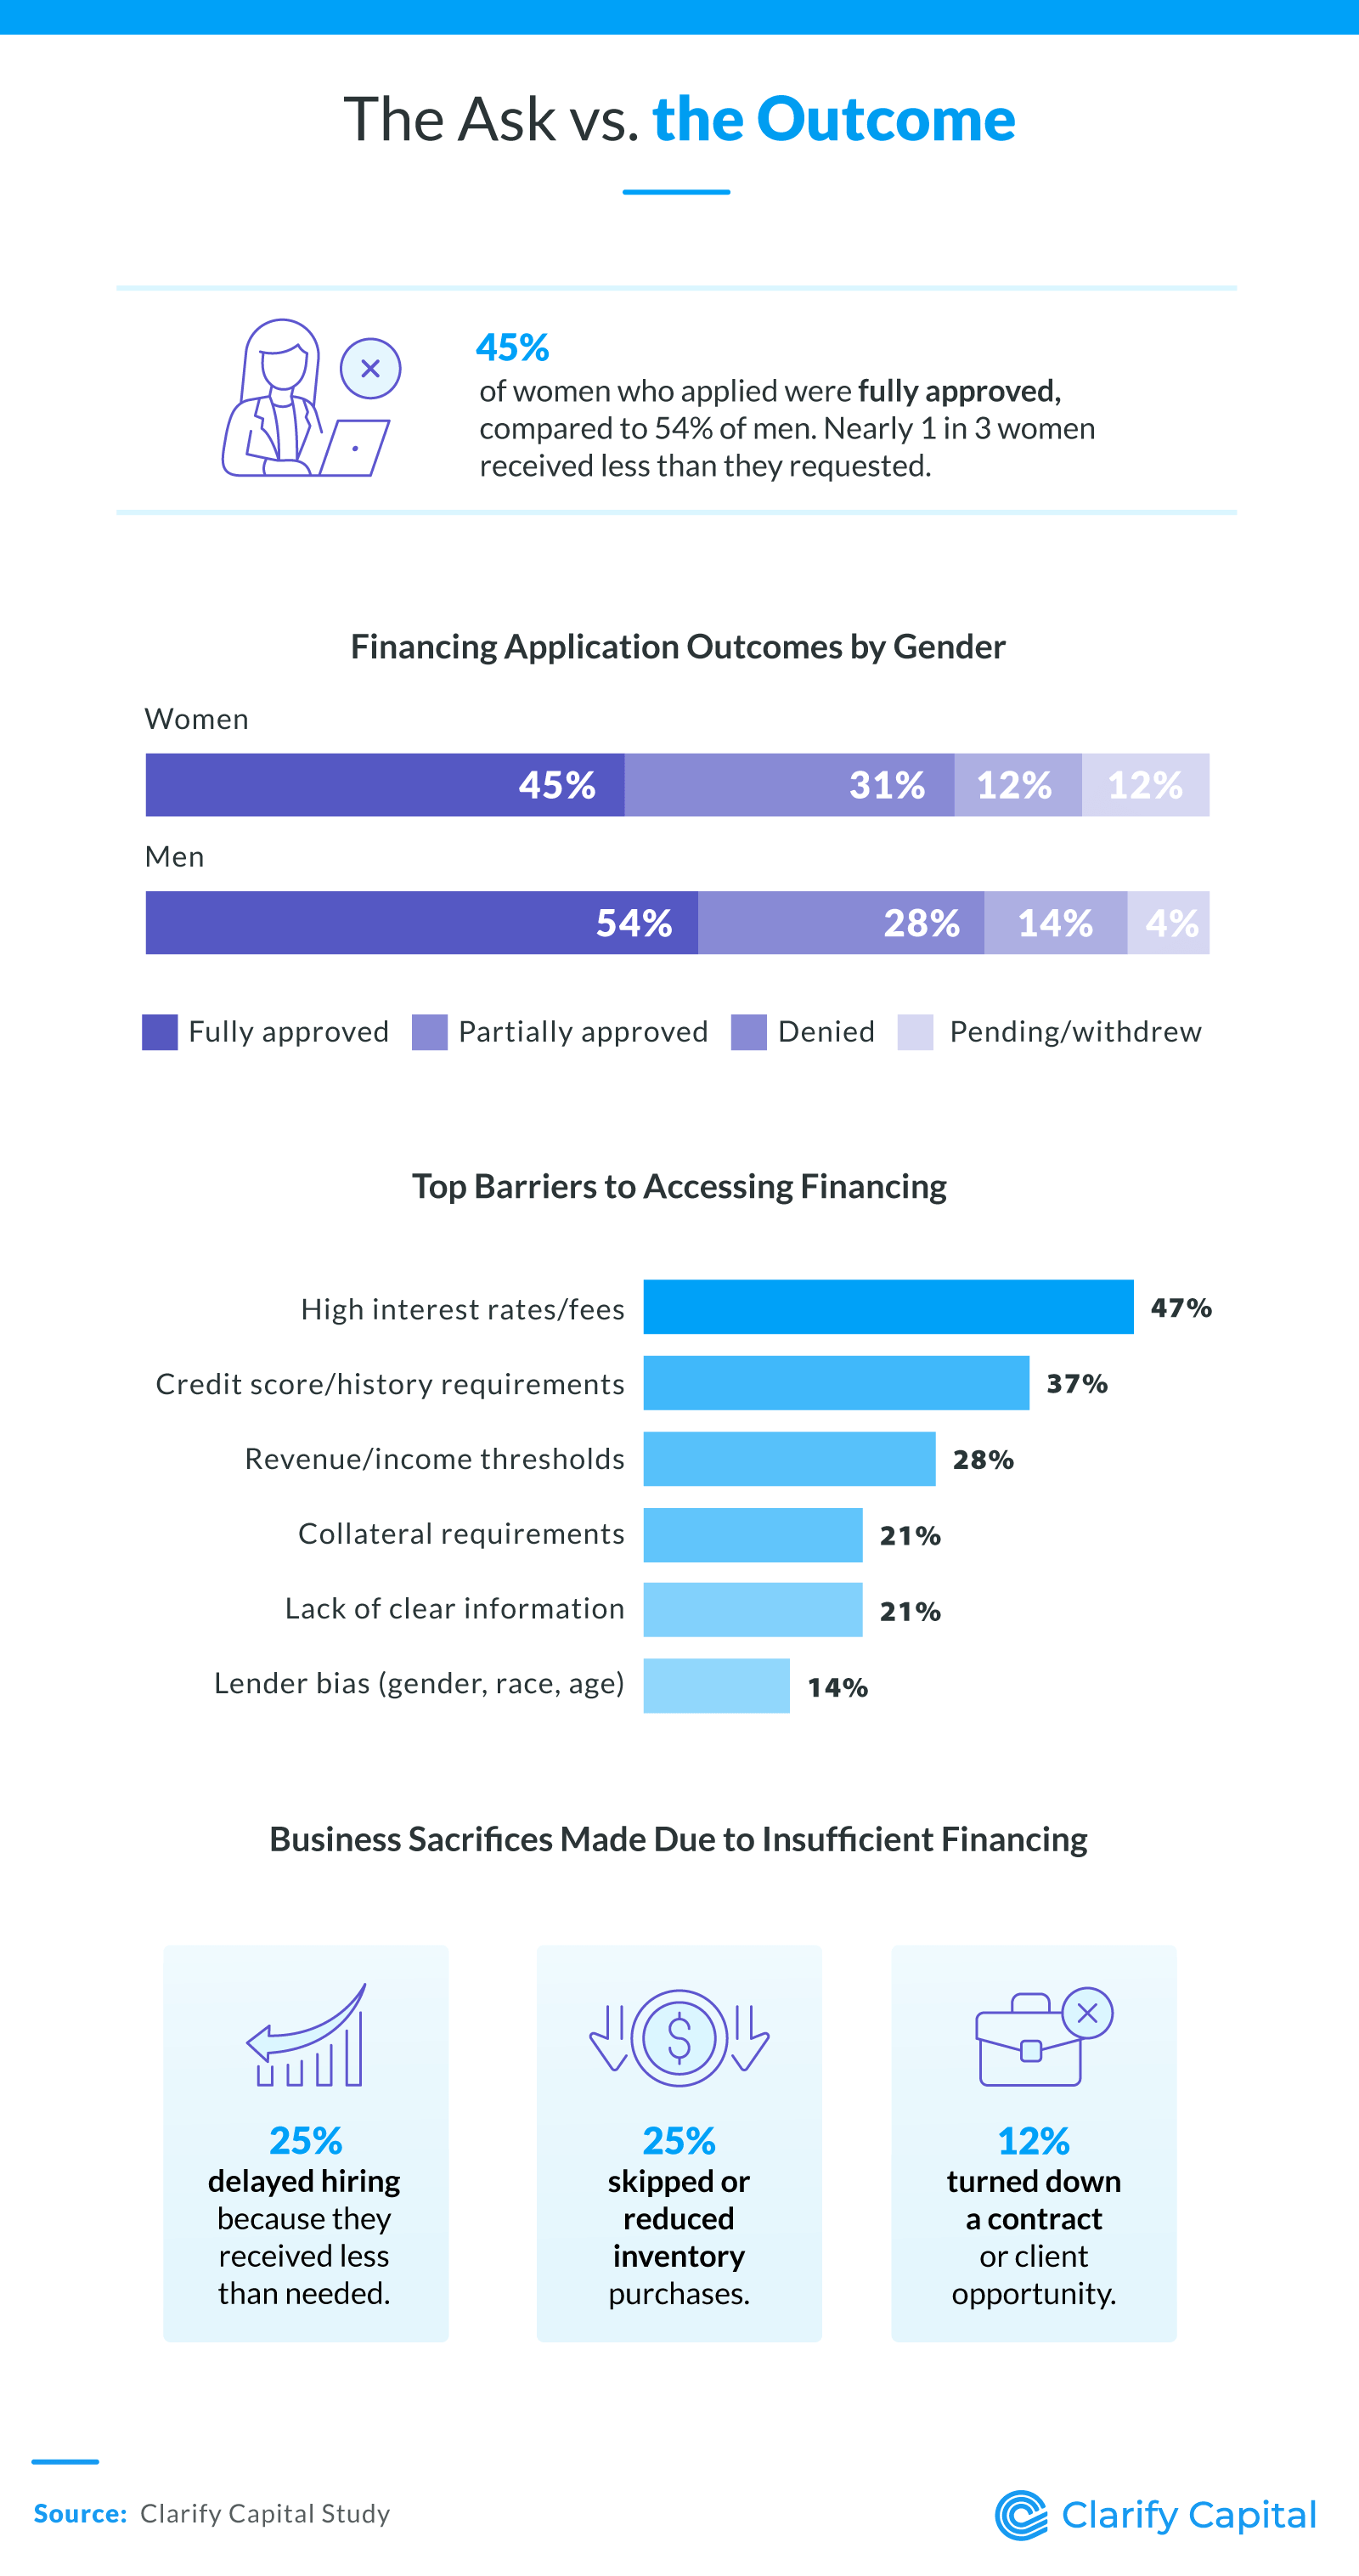
Among business owners who applied in the past 12 months, 54% of men were fully approved for the amount they requested, while fewer women were (45%). Nearly 1 in 3 women who applied (31%) received less than they requested, compared to 28% of men.
The barriers keeping founders from accessing capital are consistent across genders, though the weight of them differs. High interest rates or fees topped the list for all business owners at 47%, followed by credit score or history requirements (37%) and revenue or income thresholds (28%). These structural hurdles affect everyone, but they compound for founders who are already navigating lower approval rates.
Among all business owners who applied and were underfunded or denied, 25% delayed a hire, 25% skipped or reduced inventory, and 12% turned down a contract or client as a direct result. For women specifically, nearly 1 in 4 (23%) delayed a hire, and nearly 1 in 3 (31%) cut inventory purchases, decisions that carry long-term costs for business growth and competitiveness.
The Revenue Gap, State by State
We also analyzed U.S. Census Bureau data to explore how average revenues compare between women- and men-owned businesses across every state.
States with the highest average revenue among women-owned firms:
Illinois: $2.55M
Ohio: $2.36M
Texas: $2.32M
Arkansas: $2.17M
Louisiana: $2.13M
Alabama: $2.06M
Delaware: $2.00M
Wisconsin: $1.98M
Pennsylvania: $1.96M
New Jersey: $1.96M
States with the lowest average revenue among women-owned firms:
Idaho: $1.01M
Florida: $1.07M
West Virginia: $1.07M
South Dakota: $1.11M
Wyoming: $1.17M
Washington: $1.28M
Nebraska: $1.29M
North Carolina: $1.33M
Arizona: $1.34M
Colorado: $1.34M
States with the most women-owned firms (% of total):
Alaska: 27.2%
Virginia: 25.3%
Colorado: 25.2%
Georgia: 24.6%
Florida: 24.1%
North Carolina: 24.1%
Maryland: 24.0%
Oregon: 24.0%
New Mexico: 23.9%
California: 23.9%
States with the fewest women-owned firms (% of total):
South Dakota: 15.9%
New Hampshire: 16.8%
Delaware: 17.9%
Utah: 17.9%
North Dakota: 18.0%
West Virginia: 18.2%
Idaho: 18.6%
Iowa: 18.6%
Alabama: 18.7%
Nebraska: 18.8%
Methodology
Clarify Capital surveyed 737 U.S. business owners in May 2026. Respondents were screened to confirm active business ownership. The sample includes 57% women, 40% men, and 3% non-binary respondents. Demographic subgroups representing less than 5% of the total sample are excluded from breakdowns. Where we report averages, we removed outliers.
State-level revenue data comes from the U.S. Census Bureau's 2023 Annual Business Survey, which covers employer firms across all industries. We calculated average revenue per firm by dividing total sales, shipments, or revenue for each gender group by the corresponding number of employer firms within each state. Kentucky did not have sufficient data. We calculated women-owned firm shares as a percentage of total employer firms.
About Clarify Capital
Clarify Capital helps small and midsize business owners access the financing they need to grow with confidence. Closing the financing gap starts with knowing your options. Our small business loans for women are designed to help women entrepreneurs access capital on equal footing.
Fair Use Statement
This content may be used for noncommercial purposes only. If you share or reference this content, please provide a link and attribution to Clarify Capital.

Michael Baynes
Co-founder, Clarify
Michael has over 15 years of experience in the business finance industry working directly with entrepreneurs. He co-founded Clarify Capital with the mission to cut through the noise in the finance industry by providing fast funding and clear answers. He holds dual degrees in Accounting and Finance from the Kelley School of Business at Indiana University. More about the Clarify team →
Related Posts