
Return on Invested Capital (ROIC) is one of the most useful metrics in corporate finance, especially for business owners looking to improve decision-making and drive smarter growth. Unlike ROI or ROE, ROIC cuts through surface-level performance to measure how efficiently a company turns operating capital into real profits.
This guide breaks down everything you need to know: what ROIC is, how it works, and why it matters more than ever in 2025. Whether you're managing budgeting decisions, evaluating valuation potential, or benchmarking performance, understanding how to calculate the rate of return on invested capital gives you a sharper lens on your company's profitability.
ROIC vs ROI, ROE, and ROCE: Key Differences
Return on Invested Capital (ROIC) stands apart from other profitability metrics by zeroing in on how well a company uses its actual operating capital to generate returns. While metrics like ROI, ROE, and ROCE provide helpful insights, each serves a different purpose:
ROI (Return on Investment). Looks at the overall gain from an investment, but doesn't account for the source or structure of capital.
ROE (Return on Equity). Focuses solely on shareholders' equity, making it useful for investors but less so for internal capital analysis.
ROCE (Return on Capital Employed). Similar to ROIC, it often includes total assets rather than invested capital, which can skew results for capital-intensive businesses.
Net Income. Unlike ROI and ROE, which rely on net income, a figure influenced by non-operating gains and expenses, ROIC focuses strictly on core operating performance, giving a cleaner picture of efficiency.
In contrast, ROIC isolates operating performance, measuring how efficiently a company turns invested capital into profit. It excludes non-operating items and provides a cleaner view of how the business is actually performing at its core.
Why ROIC Is a Crucial Metric for Business Owners and Investors
ROIC is a strategic tool that helps business owners and investors make smarter investment decisions, revealing whether a company is generating value or simply treading water. A high ROIC typically signals strong company profitability, sound capital allocation, and long-term competitive advantage.
For small business owners, understanding your return on invested capital means knowing whether your growth is sustainable or if capital could be better deployed elsewhere. For investors, it's one of the clearest indicators of how well a company uses resources, not just how much profit it turns on paper.
The ROIC Formula (With Variations)
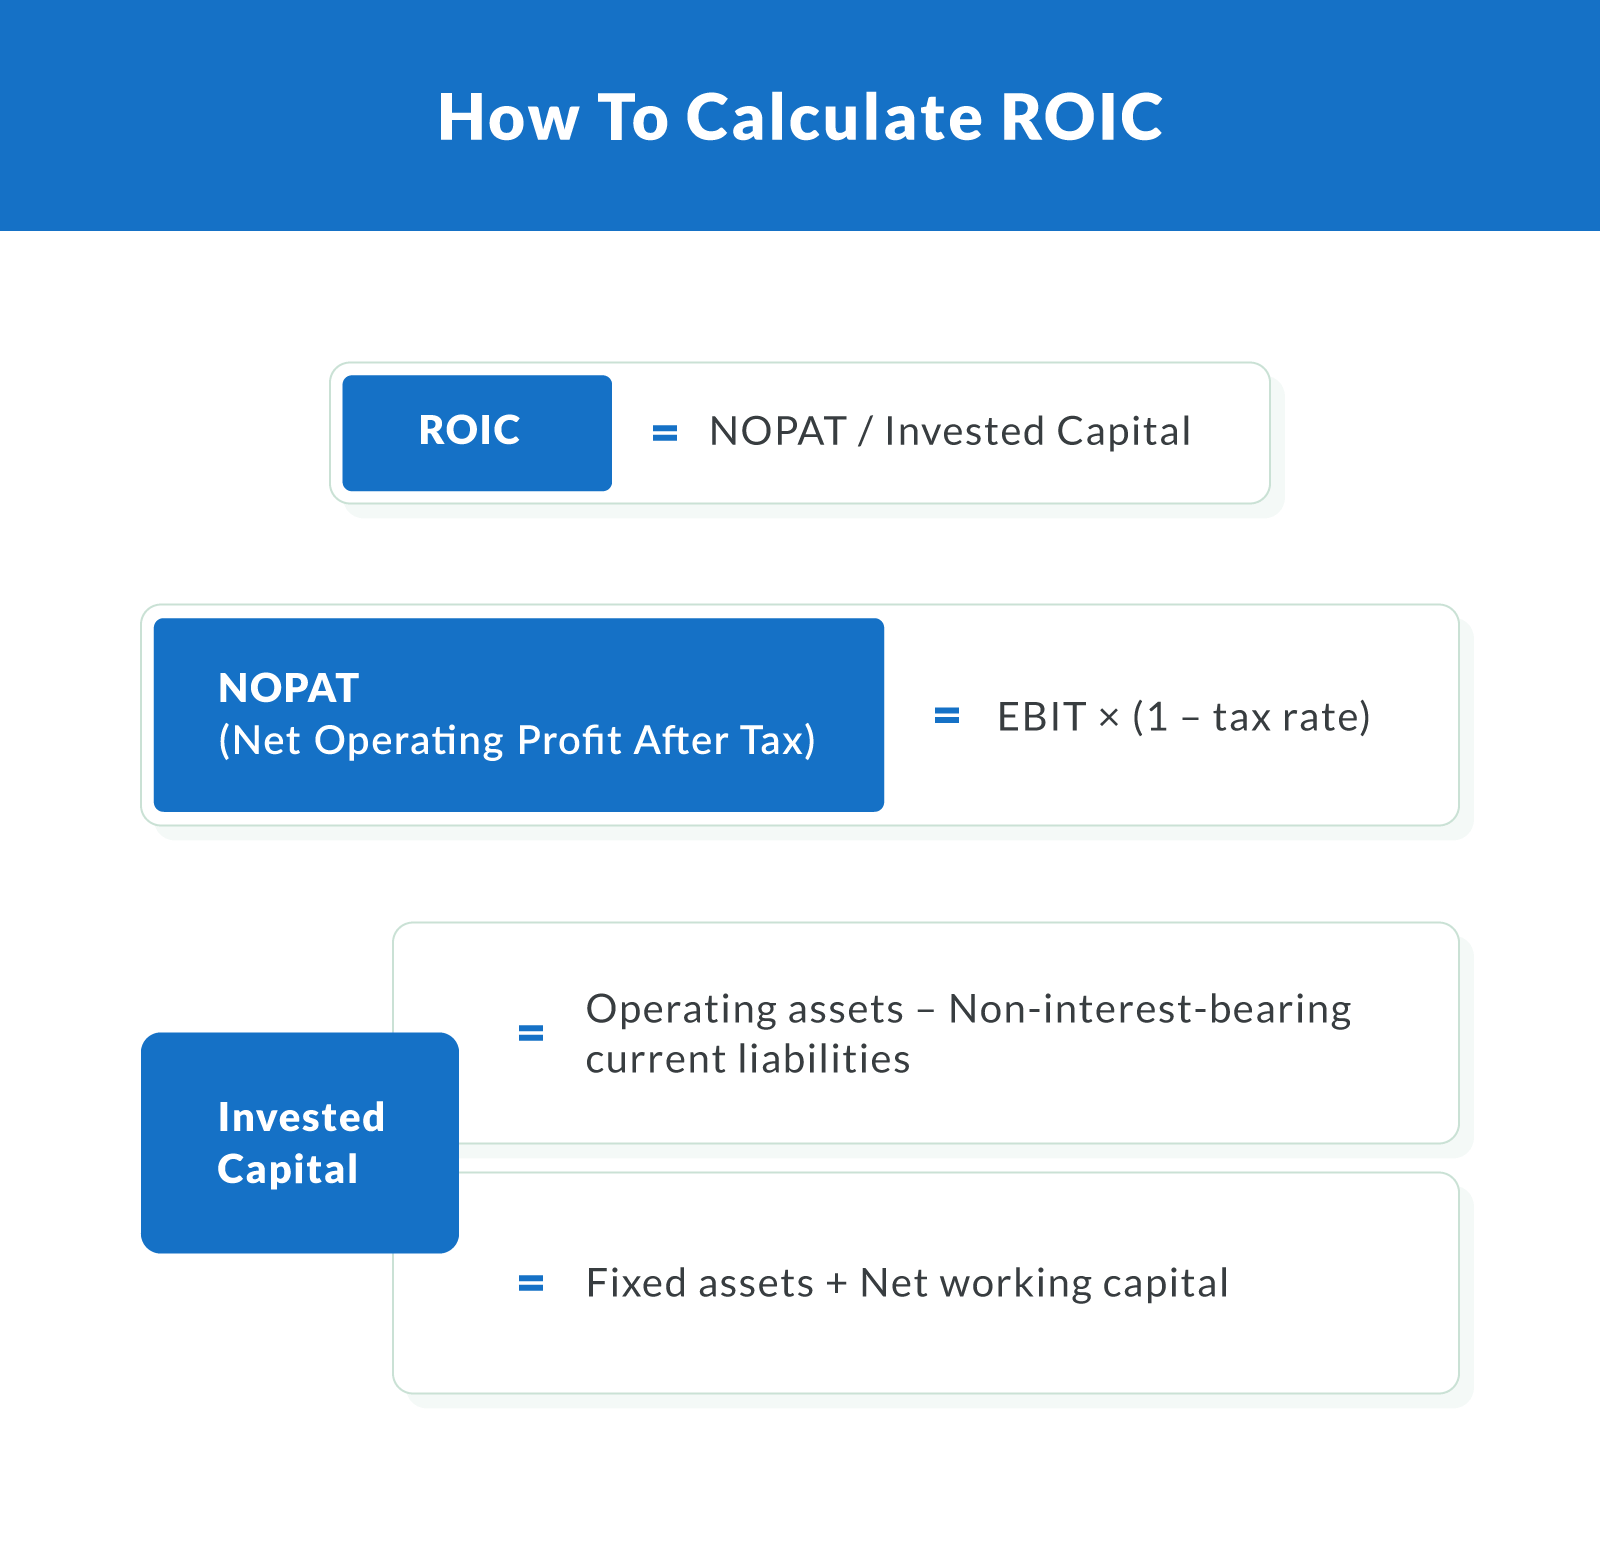
Return on Invested Capital (ROIC) measures how efficiently a business turns capital into profits from core operations. The basic formula is straightforward:
Primary Formula: ROIC = NOPAT / Invested Capital
It shows how much net operating profit after tax (NOPAT) a company earns for every dollar of invested capital. A higher percentage reflects better capital efficiency and stronger overall performance.
How to Calculate NOPAT (Net Operating Profit After Tax)
NOPAT represents your company's after-tax profits from core operations, excluding interest expenses and non-operating income. It's calculated using this formula:
NOPAT = EBIT × (1 – Tax Rate)
EBIT (Earnings Before Interest and Taxes): This is your operating income, found on your income statement.
Tax Rate: Use your company's effective tax rate or the statutory rate based on location and entity type.
NOPAT is the numerator in the ROIC equation. It focuses solely on profits from operations, not financing or non-recurring items.
Methods for Calculating Invested Capital
There are two common ways to calculate invested capital, the denominator in the ROIC formula. The best method depends on your business model and accounting preferences:
Total Assets – Current Liabilities (excluding interest-bearing debt): Ideal for service-based businesses or those with simpler balance sheets. This approach gives you a broad snapshot of invested capital without skewing for short-term debt or financing structures.
Fixed Assets + Net Working Capital: Better suited for asset-heavy businesses (like manufacturing or construction). This method isolates long-term operating assets and short-term capital used in daily operations.
Net Working Capital = Current Assets – Current Liabilities (excluding debt-related items)
Alternative ROIC Calculation Methods (When to Use Them)
In some cases, using variations on the core formula may offer more accurate insights:
Average Invested Capital: Useful for businesses with large seasonal fluctuations. It averages beginning and ending capital for the period to smooth results.
Adjustments for Goodwill or Real Estate: If your company holds significant intangible assets or property, consider separating them from operating assets unless they directly contribute to revenue generation.
Large Acquisitions: When acquisitions skew recent capital numbers, normalize ROIC by adjusting either NOPAT or capital base to reflect typical operating performance.
This flexibility makes ROIC a powerful tool for evaluating operating income efficiency across different industries and capital structures.
Step-by-Step ROIC Calculation Example
To understand how ROIC works in practice, let's look at a real-world scenario using ADP's financials from Q4 2024. This return on invested capital example simplifies key data from ADP's income statement and balance sheet to walk through a standard ROIC calculation.
Example Using ADP's 2024 Q4 Financials
We'll calculate ROIC using the standard formula:
ROIC = NOPAT / Invested Capital
From ADP's FY2024 report:
EBIT (Earnings Before Interest and Taxes): $4.65 billion
Effective Tax Rate: 19%
NOPAT = EBIT × (1 – Tax Rate) = $4.65B × (1 – 0.19) = $3.77 billion
Invested Capital: Total assets ($71.56B) – non-interest-bearing current liabilities ($22.77B) = $48.79 billion
So, the ROIC calculation is:
ROIC = $3.77B / $48.79B = 7.72%
This means ADP generated a 7.72% return on the capital it invested in its operations.
Sample Balance Sheet and Income Statement Breakdown
Here's where each number came from in ADP's Q4 2024 filing:
EBIT: Reported as "Earnings from Continuing Operations Before Income Taxes" = $4.65 billion
Tax Rate: Derived from "Provision for Income Taxes" ($883 million) / Pre-tax earnings ($4.65B) ≈ 19%
Total Assets: $71.56 billion
Current Liabilities (Non-Interest-Bearing): $22.77 billion — excludes any interest-bearing debt, which isn't counted in ROIC invested capital
This information is all publicly available in the income statement and balance sheet sections of ADP's financial statement.
Note that while ROIC typically uses EBIT to calculate NOPAT, some analysts begin with EBITDA (Earnings Before Interest, Taxes, Depreciation, and Amortization) and then subtract depreciation to arrive at EBIT. This is especially useful when depreciation is a significant non-cash expense on the income statement.
Walkthrough of the Calculation Process
To bring it all together, here's how the ROIC calculation would work step by step using simplified, real-world data:
Find EBIT: Start with ADP's "Earnings Before Income Taxes" = $4.65 billion
Calculate NOPAT: Multiply EBIT by (1 – tax rate). In this case: $4.65B × (1 – 0.19) = $3.77 billion
Calculate Invested Capital: Subtract non-interest-bearing current liabilities from total assets:
$71.56B – $22.77B = $48.79 billion
Divide NOPAT by Invested Capital:
$3.77B / $48.79B = 0.0772 or 7.72% ROIC
This ROIC calculation shows that for every dollar ADP invested in its operating assets, it generated about 7.72 cents in after-tax profit. That's a strong signal of healthy capital efficiency and a valuable benchmark for comparison in investment decisions.
ROIC Calculator (Interactive Tool)
Want a faster way to crunch the numbers? Clarify Capital's free ROIC calculator helps you instantly evaluate your return on invested capital using your business's real financials. Whether you're comparing investments, tracking business performance, or building a case for funding, this tool takes the guesswork out of ROIC.
Here's how it works:
Enter EBIT (Earnings Before Interest and Taxes): This is your operating income before taxes. You can usually find it on your income statement.
Input your tax rate: This is your effective tax rate, which you can calculate by dividing total taxes paid by pre-tax income.
Add your invested capital: This is the total capital actively used in your operations. Common formulas include:
Total assets – non-interest-bearing current liabilities
Fixed assets + net working capital
The calculator will instantly return your ROIC percentage, showing how efficiently your business turns invested capital into profit.
Need help with inputs? Each field includes hover tips:
NOPAT (Net Operating Profit After Tax): Your EBIT after accounting for taxes.
Working Capital: Current assets minus current liabilities, excluding interest-bearing debt.
WACC (Weighted Average Cost of Capital): The average rate your business is expected to pay to finance assets—helpful for comparing against ROIC to evaluate value creation.
Use this tool as part of your financial analysis strategy to make smarter capital allocation decisions, benchmark performance, and support business growth with data.
Try the free ROIC calculator now to measure how well your operating assets are working for you.
Interpreting ROIC: What's a "Good" Return?
Once you've calculated your return on invested capital, the next step is knowing what it means. A higher ROIC ratio compared to peers signals that your business is turning invested capital into profit more efficiently than competitors, often correlating with long-term valuation gains. But "good" is relative. It depends on your industry, business model, and cost of capital.
Current ROIC Benchmarks by Industry (2025 Data)
To help you interpret your results, here's a snapshot of average ROIC by sector in 2025:
| Industry | Average ROIC (2025) |
|---|---|
| Technology | 18% – 25% |
| Healthcare | 12% – 17% |
| Consumer Retail | 8% – 12% |
| Manufacturing | 6% – 10% |
| Professional Services | 10% – 14% |
These figures reflect broad trends, so if your company's ROIC is above the average for your sector, you're likely using capital efficiently and creating value.
ROIC in the S&P 500: Trends from 2024 to 2025
Among top performers in the S&P 500, ROIC remains a critical metric for investors. Companies with consistently high ROICs tend to attract stronger valuation multiples because they show reliable profitability relative to capital invested. From 2024 to 2025, sectors like tech and healthcare continued to outperform, while capital-heavy industries like manufacturing saw more modest returns due to tighter margins and elevated interest costs.
ROIC vs WACC: Understanding Value Creation
To truly assess if you're generating value, compare your ROIC to your WACC (Weighted Average Cost of Capital):
If ROIC > WACC: You're creating value. Your business earns more on each dollar of capital than it costs to obtain.
If ROIC = WACC: You're breaking even in terms of value creation.
If ROIC < WACC: You're destroying value; capital would be better invested elsewhere.
This comparison is one of Wall Street's favorite tools for valuation. It's also a smart internal benchmark for small business owners to determine where to allocate resources, improve performance, and justify expansion.
Common Pitfalls When Calculating ROIC
ROIC is a powerful metric when done right. But small mistakes can skew the numbers and lead to poor financial insights. Here are some of the most common errors to watch out for in your invested capital calculation:
Overlooking Non-Operating Assets
Exclude cash flow, excess cash equivalents, and real estate investments that aren't tied directly to core operations. These assets don't contribute to operating income and can inflate your denominator, lowering your ROIC inaccurately.
Misclassifying Debt or Equity
Only include interest-bearing liabilities in your calculation. Don't confuse operational liabilities (like accounts payable) with long-term debt that should be part of invested capital. Similarly, be sure to use the correct book value of shareholders' equity, not market value.
Using Inconsistent Time Periods for Inputs
Always match your financial statement timeframes. If you're using EBIT from a quarterly income statement, your invested capital figures should come from the same quarter's balance sheet. Mixing annual and quarterly data distorts the return ratio.
Not Adjusting for Short-Term Changes
Fluctuations in short-term assets or liabilities (like inventory spikes or prepaid expenses) can distort working capital. Use average balances when appropriate, or investigate large swings before finalizing your ROIC.
Avoiding these pitfalls ensures your invested capital calculation reflects the true efficiency of your business. Accurate ROIC helps you make better strategic decisions and spot real opportunities to improve profitability.
Strategic Use of ROIC in Business Decision-Making

ROIC is a lens for making smarter strategic choices. In corporate finance, this metric helps business owners, CFOs, and investors understand which areas of the company are generating high returns and which ones may be underperforming. When used effectively, ROIC becomes a cornerstone of capital efficiency and long-term growth.
Because ROIC focuses on operational efficiency, it excludes one-off distributions like a dividend, making it more consistent for comparing internal business units or investment scenarios.
Capital Allocation and Efficiency Analysis
ROIC allows leaders to evaluate how well different investments are performing. Whether it's expanding a facility, upgrading technology, or launching a new product line, you can use ROIC to determine if those initiatives are delivering a high enough return on capital. If the return falls below expectations, it may be time to reallocate funds toward higher-performing projects.
Comparing Divisions or Product Lines
For businesses with multiple revenue streams, ROIC helps compare internal performance beyond surface-level profitability. A product line with high margins but excessive capital requirements may yield a lower ROIC than a leaner operation with modest margins. When budgeting, use ROIC to identify which business units are maximizing value from their fixed assets and working capital.
Identifying Competitive Advantages
A high ROIC often points to more than just operational efficiency. It may signal a durable competitive edge. Businesses that consistently outperform peers on this metric likely benefit from a return on capital employed advantage, such as proprietary technology, brand strength, or superior cost control. Use ROIC as a way to validate your market position and guide strategic investments in growth areas.
In short, ROIC offers more than financial clarity. It provides actionable insight for better decision-making, sharper budgeting, and sustainable business value.
Boost Capital Efficiency With Smart ROIC Use
Return on invested capital (ROIC) gives small business owners and financial teams a sharper tool for tracking efficiency and making smarter capital decisions. Unlike broader metrics, ROIC isolates how well your core operations are turning investment into profit, making it one of the most valuable indicators of long-term sustainability.
Whether you're comparing growth opportunities, analyzing past performance, or planning your next expansion, using ROIC regularly can improve how you allocate resources and measure success. It's especially powerful when paired with budgeting tools, forecasting models, and real-time performance tracking.
Want to strengthen your company's financial strategy? Explore funding solutions with Clarify Capital and make smarter, ROIC-driven moves for your business.

Michael Baynes
Co-founder, Clarify
Michael has over 15 years of experience in the business finance industry working directly with entrepreneurs. He co-founded Clarify Capital with the mission to cut through the noise in the finance industry by providing fast funding and clear answers. He holds dual degrees in Accounting and Finance from the Kelley School of Business at Indiana University. More about the Clarify team →
Related Posts