
Key Takeaways:
Wyoming, Colorado, and Florida are the best states for small businesses in 2025.
Wyoming has the most business applications per capita (1,954.6).
New Hampshire has the most approved loans per capita (22.3), but North Dakota secures the largest average loans ($751,082).
Florida has the most small businesses per capita (13,821.6).
Where Small Business Booms and Struggles
Some states are creating environments where entrepreneurs can thrive, while others are falling behind. From tax policies to access to capital, here's how some key factors shape where small businesses succeed across the U.S.
In 2025, Wyoming, Colorado, and Florida are the best states for small business success. Each combines strong entrepreneurial activity with favorable business conditions.
Wyoming, for instance, offers a major tax advantage with no corporate or personal income tax. Colorado continues to strengthen its small business economy through legislation aimed at cutting red tape, expanding access to capital, and supporting entrepreneurs. Florida also ranks high thanks to its pro-business climate and rapid rate of small business formation.
In terms of funding, New Hampshire, Idaho, and Utah have the highest number of approved small business loans per capita, meaning entrepreneurs in these states have better odds of securing capital. But when it comes to loan size, North Dakota, Alaska, and Texas take the lead, offering approved borrowers the most financial firepower to grow.
Wyoming, Florida, and Georgia also stand out for new business application rates and small business density. That means they have a high rate of people applying to start businesses but also a large number of small businesses relative to their population. These factors point to strong startup momentum and thriving local business communities.
On the other end, West Virginia, Maryland, and Hawaii rank as the most challenging states for small businesses. These states tend to lag in funding access, new business formation, or small business presence.
Standout States by the Numbers
Every state has its strengths, but a few rise to the top when we break down the data. These standout stats highlight where small businesses are especially active and well-supported.
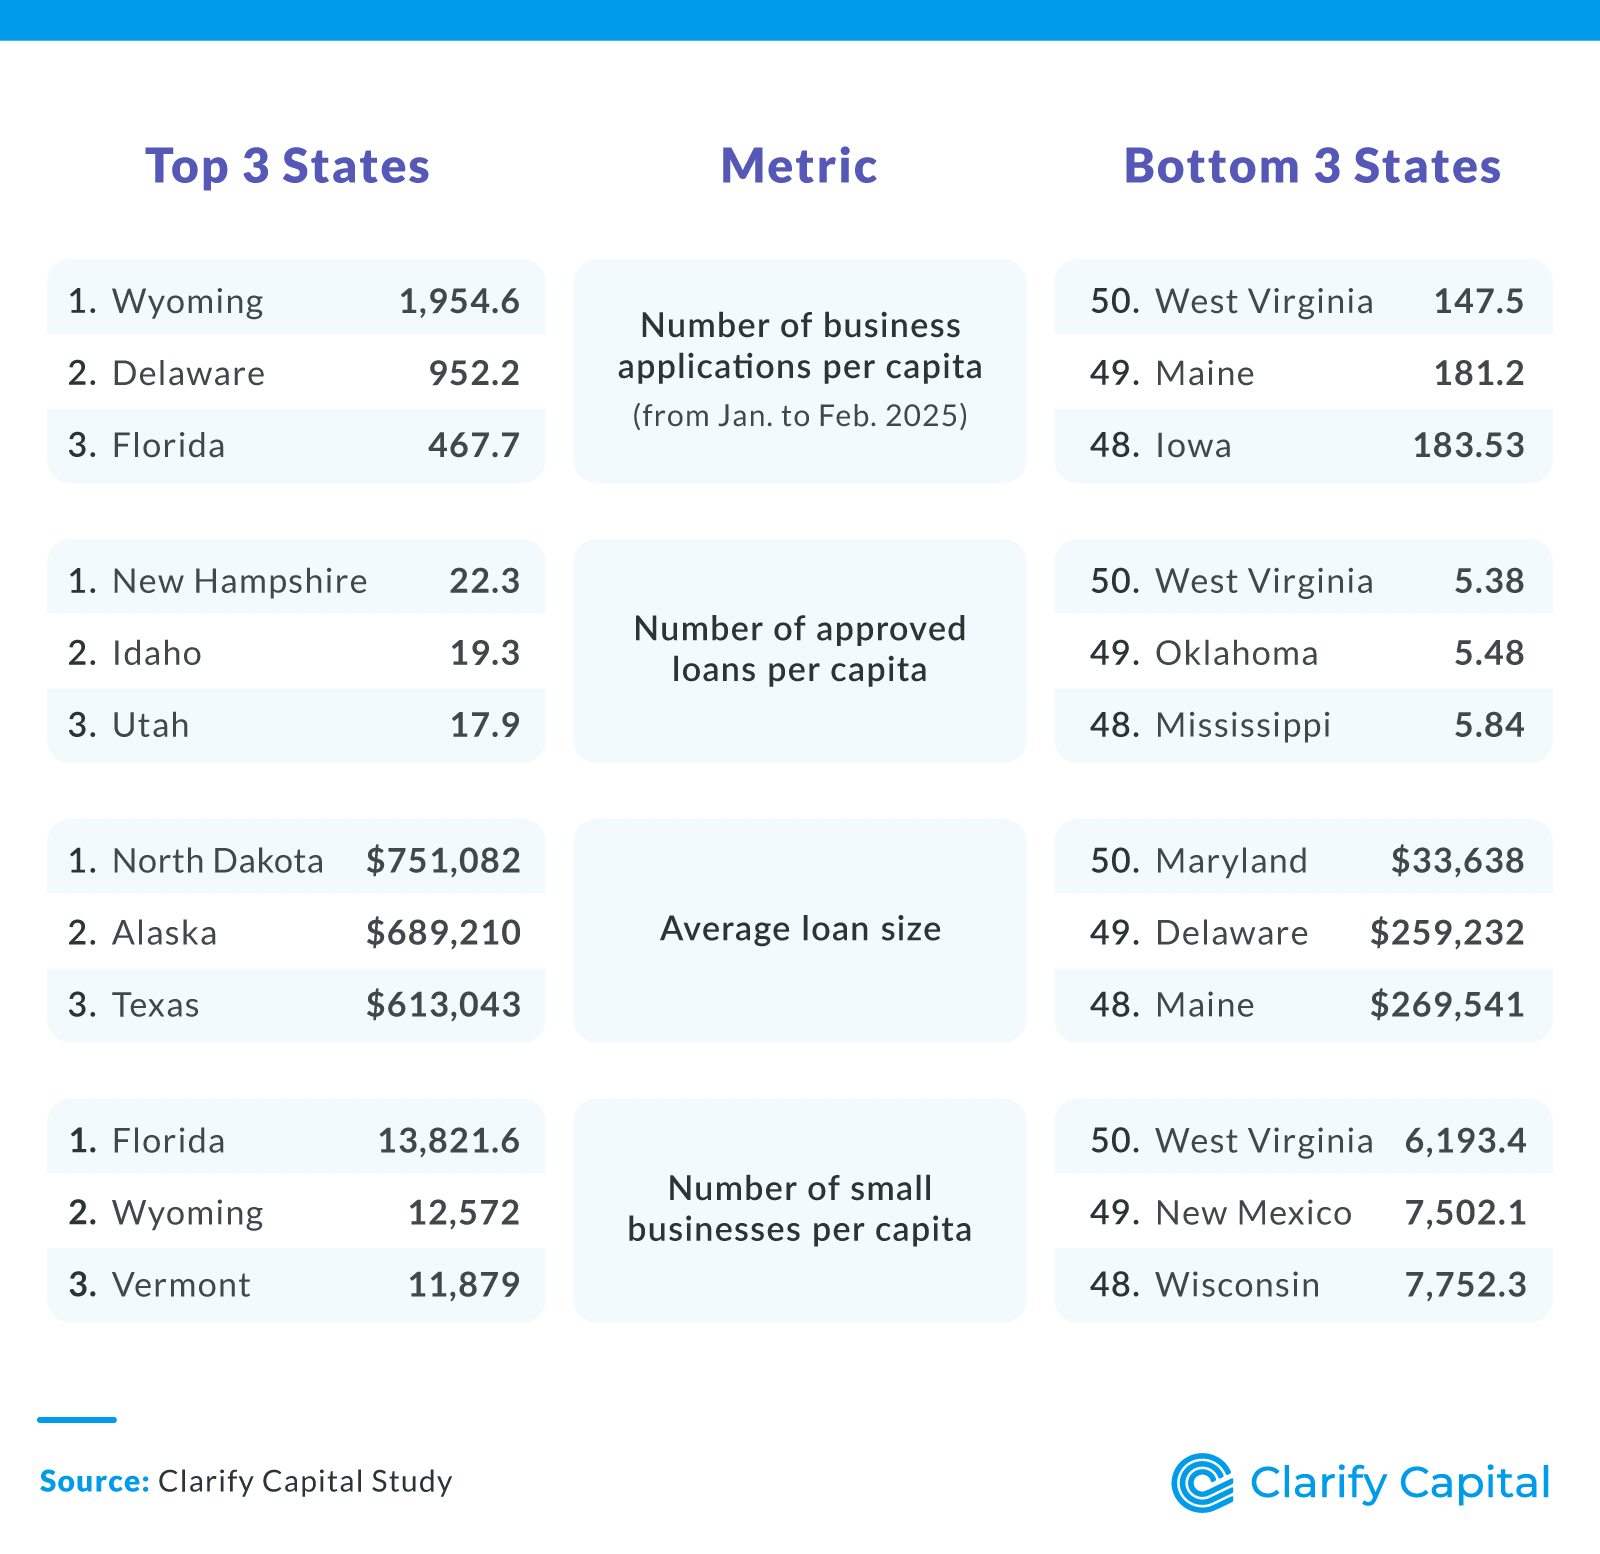
Wyoming leads the country in new business applications, with an impressive 1,954.6 applications filed per capita in early 2025. This reflects a strong appetite for entrepreneurship and a welcoming environment for new ventures.
New Hampshire ranks highest for funding access, with 22.3 approved Small Business Association (SBA) loans per capita. However, North Dakota tops the list in loan size, with an average SBA loan amount of $751,082, offering entrepreneurs more resources to scale their operations.
Florida takes the top spot for small business presence, with about 13,822 small businesses per 100,000 people. This is a strong indicator of how active and saturated the small business scene is in the state.
The Big Picture for Small Business in 2025
While every state has its own advantages, some clearly stand out for fostering strong ecosystems for small businesses. High application rates, better access to capital, and favorable policies all play a role in where entrepreneurs choose to launch and grow. Whether you're a founder planning your next move or a policymaker looking to support local businesses, these state-by-state insights reveal where small businesses are most and least likely to thrive this year.
Methodology
To determine the best states for small businesses, we analyzed four key factors and weighted them as follows:
Number of small business applications per capita (30%)
This measures entrepreneurial activity and interest in forming new businesses. We used early 2025 application data (January–February), which may not reflect full-year trends. Source: U.S. Census Bureau
Number of small businesses per capita (20%)
This indicates the density of small businesses relative to the population, reflecting business viability and competition. Based on the most recent data available (2023). Source: U.S. Small Business Administration Office of Advocacy
Number of SBA loan approvals and average loan amounts by state (50% total)
SBA loan data provides insight into funding accessibility, a critical factor for small business success and growth. Data reflects the 2025 fiscal year as of March 10, 2025, when it was collected; this data source is updated regularly. Source: U.S. Small Business Association
Number of approved loans (25%)
Average loan amount approved (25%)
Other influential factors, such as tax policies, cost of living, and labor market conditions, were not included in this ranking.
About Clarify Capital
Clarify Capital helps business owners secure the financing they need to thrive in today's competitive marketplace, including no-doc business loans and fast business loans. Our tailored financial solutions support entrepreneurial dreams, turning visions into reality.
Fair Use Statement
You may share this information for noncommercial use as long as you provide a link to the page.

Bryan Gerson
Co-founder, Clarify
Bryan has personally arranged over $900 million in funding for businesses across trucking, restaurants, retail, construction, and healthcare. Since graduating from the University of Arizona in 2011, Bryan has spent his entire career in alternative finance, helping business owners secure capital when traditional banks turn them away. He specializes in bad credit funding, no doc lending, invoice factoring, and working capital solutions. More about the Clarify team →
Related Posts